In 1977, USD234’s budget was discussed in the Tribune. The story lists the district’s budget as $2,332,642 and the number of students as 2112 for the year, which gives a cost per student of $1,104.47.
This historical cost per student is now part of the data that school districts submit to the state, but the district no longer has (or can’t easily obtain) records before 2002.
The most recent cost per student at USD234 was $19,110 in 2024. This was down just slightly from the $19,235 cost per student in 2023. While $19,110 is $18,006 more than what each student cost in 1977, inflation accounts for a portion of that increase.
In 1977, the average annual wage in the United States was $9,779.44, and a new car could be purchased for $3,000 to $6,000. To obtain a fair comparison, one needs to graph the growth of spending against the amount of the 1977 cost per student, adjusted for inflation, each year. While no data was available from 1978 to 2001, those amounts have been represented as an even increase between the 1977 amount and the amount in 2001. The actual cost per student between those years may not be individually accurate, but the growth rate will be correct. Inflation numbers come from BLS.gov.
There may be some minor discrepancies due to school years not aligning with the Jan to Dec, inflation numbers used in the calculation, but those issues will average out over longer periods of time.
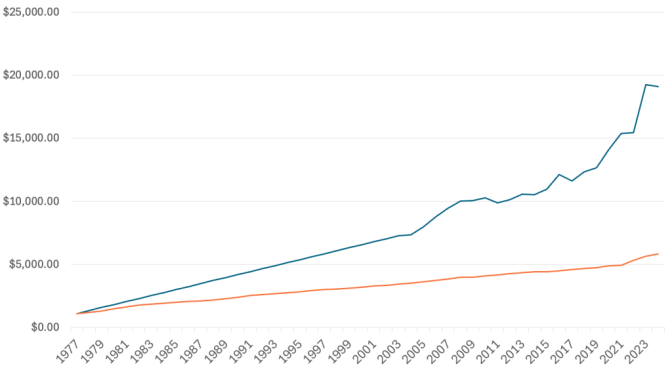
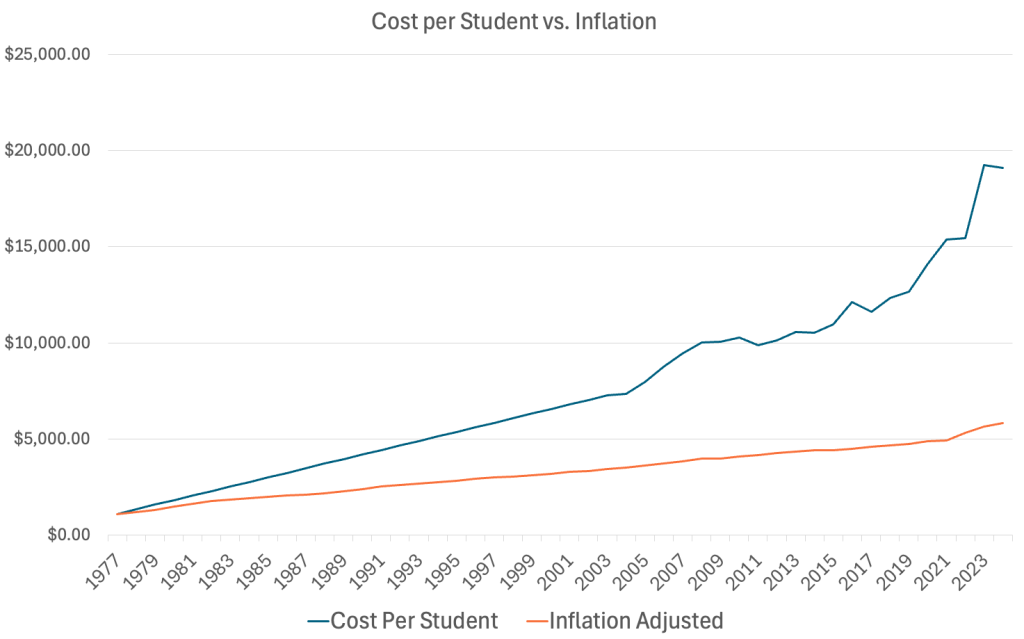
According to the data, if USD234 spent the same amount as they did in 1977, while increasing it as needed to keep up with inflation, the expected cost per student would $5,882 in 2024. Instead, the cost per student is $19,110, representing an increase of $13,288, or 228% more than what can be explained by inflation. For context, if the average wage of $9,779.44 had grown by the same amount, the average wage would now be $169,207. (In 2023, the average wage in the US was $66,621)
Obviously, inflation isn’t the only thing that drives up the cost of education, but it is a critical component and essential to factor in when comparing the current costs to historical.
Below is a chart of the data. Italicized numbers were not available from the school district and are extrapolated from the overall growth rate.
| USD234 Historical Cost Per Student | Inflation Adjusted from 1977 baseline | |
| 1977 | $1,104.47 | $1,104.47 |
| 1978 | $1,341.37 | $1,179.99 |
| 1979 | $1,578.27 | $1,289.49 |
| 1980 | $1,815.17 | $1,468.85 |
| 1981 | $2,052.07 | $1,642.55 |
| 1982 | $2,288.98 | $1,780.37 |
| 1983 | $2,525.88 | $1,846.45 |
| 1984 | $2,762.78 | $1,923.85 |
| 1985 | $2,999.68 | $1,991.82 |
| 1986 | $3,236.58 | $2,069.23 |
| 1987 | $3,473.48 | $2,099.43 |
| 1988 | $3,710.38 | $2,184.40 |
| 1989 | $3,947.28 | $2,286.35 |
| 1990 | $4,184.19 | $2,405.29 |
| 1991 | $4,421.09 | $2,541.22 |
| 1992 | $4,657.99 | $2,607.30 |
| 1993 | $4,894.89 | $2,692.26 |
| 1994 | $5,131.79 | $2,760.23 |
| 1995 | $5,368.69 | $2,837.63 |
| 1996 | $5,605.59 | $2,915.05 |
| 1997 | $5,842.49 | $3,003.78 |
| 1998 | $6,079.40 | $3,050.98 |
| 1999 | $6,316.30 | $3,101.95 |
| 2000 | $6,553.20 | $3,186.92 |
| 2001 | $6,790.10 | $3,305.86 |
| 2002 | $7,027.00 | $3,343.62 |
| 2003 | $7,288.00 | $3,430.46 |
| 2004 | $7,356.00 | $3,496.55 |
| 2005 | $7,950.00 | $3,600.38 |
| 2006 | $8,751.00 | $3,743.87 |
| 2007 | $9,444.00 | $3,821.58 |
| 2008 | $10,014.00 | $3,985.16 |
| 2009 | $10,042.00 | $3,986.35 |
| 2010 | $10,275.00 | $4,091.01 |
| 2011 | $9,863.00 | $4,146.21 |
| 2012 | $10,142.00 | $4,279.39 |
| 2013 | $10,548.00 | $4,347.64 |
| 2014 | $10,529.00 | $4,416.29 |
| 2015 | $10,962.00 | $4,412.35 |
| 2016 | $12,111.00 | $4,472.94 |
| 2017 | $11,608.00 | $4,584.76 |
| 2018 | $12,353.00 | $4,679.69 |
| 2019 | $12,652.00 | $4,752.28 |
| 2020 | $14,094.00 | $4,870.45 |
| 2021 | $15,383.00 | $4,938.62 |
| 2022 | $15,453.00 | $5,308.02 |
| 2023 | $19,235.00 | $5,648.28 |
| 2024 | $19,110.00 | $5,822.86 |